The award-winning WIRED UK Podcast with James Temperton and the rest of the team. Listen every week for the an informed and entertaining rundown of latest technology, science, business and culture news. New episodes every Friday.
…
continue reading
LessWrong에서 제공하는 콘텐츠입니다. 에피소드, 그래픽, 팟캐스트 설명을 포함한 모든 팟캐스트 콘텐츠는 LessWrong 또는 해당 팟캐스트 플랫폼 파트너가 직접 업로드하고 제공합니다. 누군가가 귀하의 허락 없이 귀하의 저작물을 사용하고 있다고 생각되는 경우 여기에 설명된 절차를 따르실 수 있습니다 https://ko.player.fm/legal.
LessWrong (Curated & Popular)와 비슷한 콘텐츠
The director’s commentary track for Daring Fireball. Long digressions on Apple, technology, design, movies, and more.
…
continue reading
Hanselminutes is Fresh Air for Developers. A weekly commute-time podcast that promotes fresh technology and fresh voices. Talk and Tech for Developers, Life-long Learners, and Technologists.
…
continue reading
The power of Data is undeniable. And unharnessed - it's nothing but chaos. Making data your ally. Using it to lead with confidence and clarity. Host Jess Carter is solving problems in real-time to reveal what's possible. Helping communities and people thrive. This is Data Driven Leadership, a show brought to you by Resultant.
…
continue reading
WSJ’s Bold Names brings you conversations with the leaders of the bold-named companies featured in the pages of The Wall Street Journal. Hosts Tim Higgins and Christopher Mims speak to CEOs and business leaders in interviews that challenge conventional wisdom and take you inside the decisions being made in the C-suite and beyond.
…
continue reading
We help founders make something people want. The Y Combinator Podcast is where builders talk about building. From the earliest days of an idea to scaling a company that changes the world, YC partners and founders share real stories, lessons, and tactics from the frontlines.
…
continue reading
Redefining AI is the 2024 New York Digital Award winning tech podcast! Discover a whole new take on Artificial Intelligence in joining host Lauren Hawker Zafer, a top voice in Artificial Intelligence on LinkedIn, for insightful chats that unravel the fascinating world of tech innovation, use case exploration and AI knowledge. Dive into candid discussions with accomplished industry experts and established academics. With each episode, you'll expand your grasp of cutting-edge technologies and ...
…
continue reading
Big tech is transforming every aspect of our world. But how, and at what cost? This season of Land of the Giants – The Disney Dilemma – focuses on Disney’s ability to weather the ups and downs of the business cycle and changing tastes and explores what has kept it successful for over 100 years. The entertainment giant has leveraged nostalgia and its intellectual property to build a beloved brand, but after an acquisition spree that included Marvel, Lucasfilm, and 20th Century Fox, can it sus ...
…
continue reading
Tom Merritt and the team help you stay up to date with an independent, authoritative and trustworthy tech news briefing. Hosted on Acast. See acast.com/privacy for more information.
…
continue reading
The Upaya Dharma Podcast features Wednesday evening Dharma Talks and recordings from Upaya’s diverse array of programs. Our podcasts exemplify Upaya’s focus on socially engaged Buddhism, including prison work, end-of-life care, serving the homeless, training in socially engaged practices, peace & nonviolence, compassionate care training, and delivering healthcare in the Himalayas.
…
continue reading
Player FM -팟 캐스트 앱
Player FM 앱으로 오프라인으로 전환하세요!
Player FM 앱으로 오프라인으로 전환하세요!

))
“Where is the Capital? An Overview” by johnswentworth
Manage episode 519990485 series 3364760
LessWrong에서 제공하는 콘텐츠입니다. 에피소드, 그래픽, 팟캐스트 설명을 포함한 모든 팟캐스트 콘텐츠는 LessWrong 또는 해당 팟캐스트 플랫폼 파트너가 직접 업로드하고 제공합니다. 누군가가 귀하의 허락 없이 귀하의 저작물을 사용하고 있다고 생각되는 경우 여기에 설명된 절차를 따르실 수 있습니다 https://ko.player.fm/legal.
When a new dollar goes into the capital markets, after being bundled and securitized and lent several times over, where does it end up? When society's total savings increase, what capital assets do those savings end up invested in?
When economists talk about “capital assets”, they mean things like roads, buildings and machines. When I read through a company's annual reports, lots of their assets are instead things like stocks and bonds, short-term debt, and other “financial” assets - i.e. claims on other people's stuff. In theory, for every financial asset, there's a financial liability somewhere. For every bond asset, there's some payer for whom that bond is a liability. Across the economy, they all add up to zero. What's left is the economists’ notion of capital, the nonfinancial assets: the roads, buildings, machines and so forth.
Very roughly speaking, when there's a net increase in savings, that's where it has to end up - in the nonfinancial assets.
I wanted to get a more tangible sense of what nonfinancial assets look like, of where my savings are going in the physical world. So, back in 2017 I pulled fundamentals data on ~2100 publicly-held US companies. I looked at [...]
---
Outline:
(02:01) Disclaimers
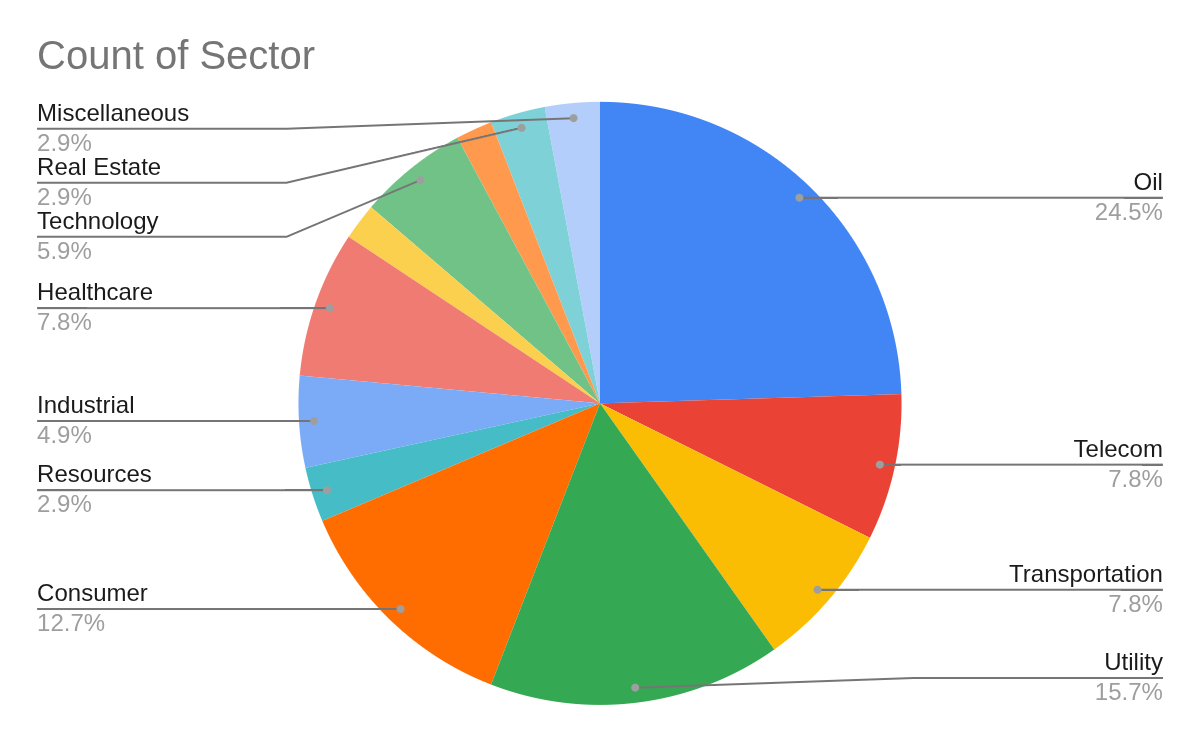
(04:10) Overview (With Numbers!)
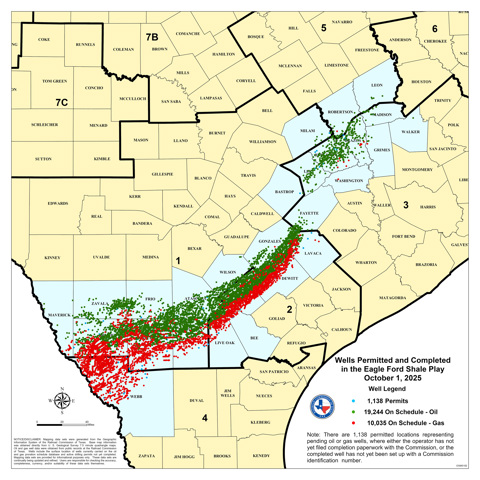
(05:01) Oil - 25%
(06:26) Power Grid - 16%
(07:07) Consumer - 13%
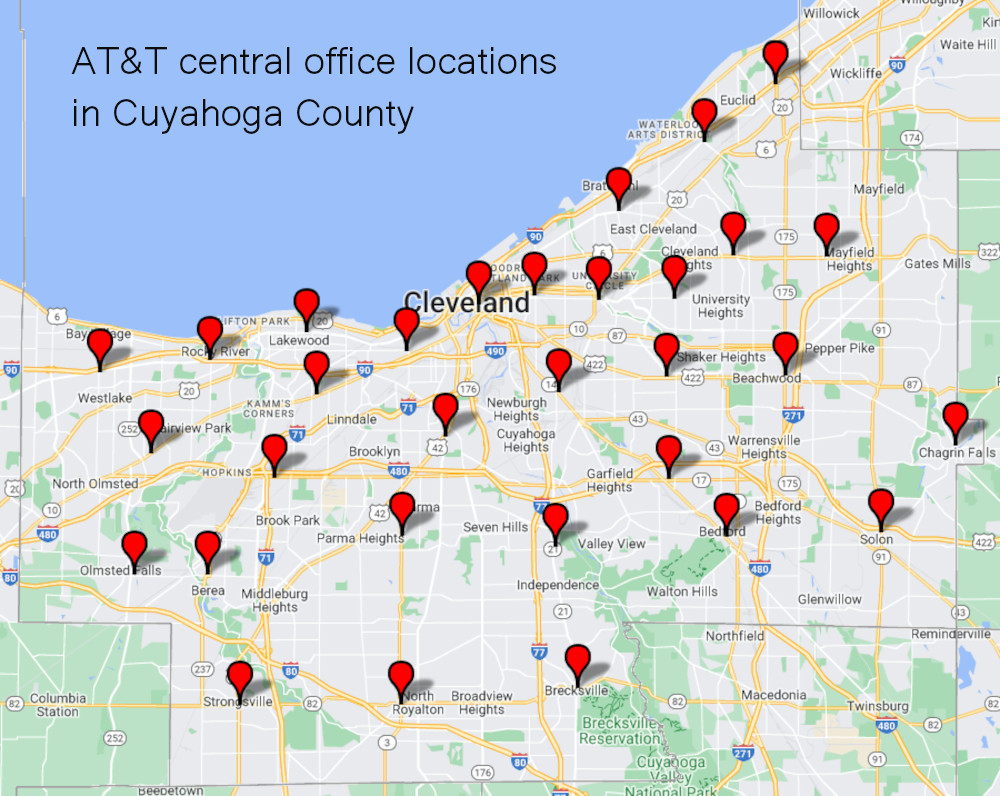
(08:12) Telecoms - 8%
(09:26) Railroads - 8%
(10:47) Healthcare - 8%
(12:03) Tech - 6%
(12:51) Industrial - 5%
(13:49) Mining - 3%
(14:34) Real Estate - 3%
(14:49) Automotive - 2%
(15:32) Logistics - 1%
(16:12) Miscellaneous
(16:55) Learnings
---
First published:
November 16th, 2025
Source:
https://www.lesswrong.com/posts/HpBhpRQCFLX9tx62Z/where-is-the-capital-an-overview
---
Narrated by TYPE III AUDIO.
---
…
continue reading
When economists talk about “capital assets”, they mean things like roads, buildings and machines. When I read through a company's annual reports, lots of their assets are instead things like stocks and bonds, short-term debt, and other “financial” assets - i.e. claims on other people's stuff. In theory, for every financial asset, there's a financial liability somewhere. For every bond asset, there's some payer for whom that bond is a liability. Across the economy, they all add up to zero. What's left is the economists’ notion of capital, the nonfinancial assets: the roads, buildings, machines and so forth.
Very roughly speaking, when there's a net increase in savings, that's where it has to end up - in the nonfinancial assets.
I wanted to get a more tangible sense of what nonfinancial assets look like, of where my savings are going in the physical world. So, back in 2017 I pulled fundamentals data on ~2100 publicly-held US companies. I looked at [...]
---
Outline:
(02:01) Disclaimers
(04:10) Overview (With Numbers!)
(05:01) Oil - 25%
(06:26) Power Grid - 16%
(07:07) Consumer - 13%
(08:12) Telecoms - 8%
(09:26) Railroads - 8%
(10:47) Healthcare - 8%
(12:03) Tech - 6%
(12:51) Industrial - 5%
(13:49) Mining - 3%
(14:34) Real Estate - 3%
(14:49) Automotive - 2%
(15:32) Logistics - 1%
(16:12) Miscellaneous
(16:55) Learnings
---
First published:
November 16th, 2025
Source:
https://www.lesswrong.com/posts/HpBhpRQCFLX9tx62Z/where-is-the-capital-an-overview
---
Narrated by TYPE III AUDIO.
---
680 에피소드
Manage episode 519990485 series 3364760
LessWrong에서 제공하는 콘텐츠입니다. 에피소드, 그래픽, 팟캐스트 설명을 포함한 모든 팟캐스트 콘텐츠는 LessWrong 또는 해당 팟캐스트 플랫폼 파트너가 직접 업로드하고 제공합니다. 누군가가 귀하의 허락 없이 귀하의 저작물을 사용하고 있다고 생각되는 경우 여기에 설명된 절차를 따르실 수 있습니다 https://ko.player.fm/legal.
When a new dollar goes into the capital markets, after being bundled and securitized and lent several times over, where does it end up? When society's total savings increase, what capital assets do those savings end up invested in?
When economists talk about “capital assets”, they mean things like roads, buildings and machines. When I read through a company's annual reports, lots of their assets are instead things like stocks and bonds, short-term debt, and other “financial” assets - i.e. claims on other people's stuff. In theory, for every financial asset, there's a financial liability somewhere. For every bond asset, there's some payer for whom that bond is a liability. Across the economy, they all add up to zero. What's left is the economists’ notion of capital, the nonfinancial assets: the roads, buildings, machines and so forth.
Very roughly speaking, when there's a net increase in savings, that's where it has to end up - in the nonfinancial assets.
I wanted to get a more tangible sense of what nonfinancial assets look like, of where my savings are going in the physical world. So, back in 2017 I pulled fundamentals data on ~2100 publicly-held US companies. I looked at [...]
---
Outline:
(02:01) Disclaimers
(04:10) Overview (With Numbers!)
(05:01) Oil - 25%
(06:26) Power Grid - 16%
(07:07) Consumer - 13%
(08:12) Telecoms - 8%
(09:26) Railroads - 8%
(10:47) Healthcare - 8%
(12:03) Tech - 6%
(12:51) Industrial - 5%
(13:49) Mining - 3%
(14:34) Real Estate - 3%
(14:49) Automotive - 2%
(15:32) Logistics - 1%
(16:12) Miscellaneous
(16:55) Learnings
---
First published:
November 16th, 2025
Source:
https://www.lesswrong.com/posts/HpBhpRQCFLX9tx62Z/where-is-the-capital-an-overview
---
Narrated by TYPE III AUDIO.
---
…
continue reading
When economists talk about “capital assets”, they mean things like roads, buildings and machines. When I read through a company's annual reports, lots of their assets are instead things like stocks and bonds, short-term debt, and other “financial” assets - i.e. claims on other people's stuff. In theory, for every financial asset, there's a financial liability somewhere. For every bond asset, there's some payer for whom that bond is a liability. Across the economy, they all add up to zero. What's left is the economists’ notion of capital, the nonfinancial assets: the roads, buildings, machines and so forth.
Very roughly speaking, when there's a net increase in savings, that's where it has to end up - in the nonfinancial assets.
I wanted to get a more tangible sense of what nonfinancial assets look like, of where my savings are going in the physical world. So, back in 2017 I pulled fundamentals data on ~2100 publicly-held US companies. I looked at [...]
---
Outline:
(02:01) Disclaimers
(04:10) Overview (With Numbers!)
(05:01) Oil - 25%
(06:26) Power Grid - 16%
(07:07) Consumer - 13%
(08:12) Telecoms - 8%
(09:26) Railroads - 8%
(10:47) Healthcare - 8%
(12:03) Tech - 6%
(12:51) Industrial - 5%
(13:49) Mining - 3%
(14:34) Real Estate - 3%
(14:49) Automotive - 2%
(15:32) Logistics - 1%
(16:12) Miscellaneous
(16:55) Learnings
---
First published:
November 16th, 2025
Source:
https://www.lesswrong.com/posts/HpBhpRQCFLX9tx62Z/where-is-the-capital-an-overview
---
Narrated by TYPE III AUDIO.
---
680 에피소드
모든 에피소드
×플레이어 FM에 오신것을 환영합니다!
플레이어 FM은 웹에서 고품질 팟캐스트를 검색하여 지금 바로 즐길 수 있도록 합니다. 최고의 팟캐스트 앱이며 Android, iPhone 및 웹에서도 작동합니다. 장치 간 구독 동기화를 위해 가입하세요.
LessWrong (Curated & Popular)와 비슷한 콘텐츠
The award-winning WIRED UK Podcast with James Temperton and the rest of the team. Listen every week for the an informed and entertaining rundown of latest technology, science, business and culture news. New episodes every Friday.
…
continue reading
The director’s commentary track for Daring Fireball. Long digressions on Apple, technology, design, movies, and more.
…
continue reading
Hanselminutes is Fresh Air for Developers. A weekly commute-time podcast that promotes fresh technology and fresh voices. Talk and Tech for Developers, Life-long Learners, and Technologists.
…
continue reading
The power of Data is undeniable. And unharnessed - it's nothing but chaos. Making data your ally. Using it to lead with confidence and clarity. Host Jess Carter is solving problems in real-time to reveal what's possible. Helping communities and people thrive. This is Data Driven Leadership, a show brought to you by Resultant.
…
continue reading
WSJ’s Bold Names brings you conversations with the leaders of the bold-named companies featured in the pages of The Wall Street Journal. Hosts Tim Higgins and Christopher Mims speak to CEOs and business leaders in interviews that challenge conventional wisdom and take you inside the decisions being made in the C-suite and beyond.
…
continue reading
We help founders make something people want. The Y Combinator Podcast is where builders talk about building. From the earliest days of an idea to scaling a company that changes the world, YC partners and founders share real stories, lessons, and tactics from the frontlines.
…
continue reading
Redefining AI is the 2024 New York Digital Award winning tech podcast! Discover a whole new take on Artificial Intelligence in joining host Lauren Hawker Zafer, a top voice in Artificial Intelligence on LinkedIn, for insightful chats that unravel the fascinating world of tech innovation, use case exploration and AI knowledge. Dive into candid discussions with accomplished industry experts and established academics. With each episode, you'll expand your grasp of cutting-edge technologies and ...
…
continue reading
Big tech is transforming every aspect of our world. But how, and at what cost? This season of Land of the Giants – The Disney Dilemma – focuses on Disney’s ability to weather the ups and downs of the business cycle and changing tastes and explores what has kept it successful for over 100 years. The entertainment giant has leveraged nostalgia and its intellectual property to build a beloved brand, but after an acquisition spree that included Marvel, Lucasfilm, and 20th Century Fox, can it sus ...
…
continue reading
Tom Merritt and the team help you stay up to date with an independent, authoritative and trustworthy tech news briefing. Hosted on Acast. See acast.com/privacy for more information.
…
continue reading
The Upaya Dharma Podcast features Wednesday evening Dharma Talks and recordings from Upaya’s diverse array of programs. Our podcasts exemplify Upaya’s focus on socially engaged Buddhism, including prison work, end-of-life care, serving the homeless, training in socially engaged practices, peace & nonviolence, compassionate care training, and delivering healthcare in the Himalayas.
…
continue reading
Player FM -팟 캐스트 앱
Player FM 앱으로 오프라인으로 전환하세요!
Player FM 앱으로 오프라인으로 전환하세요!


